


Imagine driving a car with your eyes closed. Sounds reckless, right? Unfortunately, this is exactly what many teams do when they neglect monitoring in their DevOps practices.
Monitoring is not just a safety net; it’s an essential part of a robust DevOps strategy. Ignoring it can lead to unexpected system breakdowns and chaotic firefighting.
DevOps is a methodology that combines development and operations to achieve fast and reliable software delivery. Monitoring is a critical component of DevOps that enables teams to detect and resolve issues quickly, ensuring that applications are performing optimally. Monitoring in DevOps involves the continuous collection and analysis of system metrics to identify potential problems before they occur.

Without monitoring, it is difficult to identify performance bottlenecks or detect issues that could lead to system failure. This can result in customer dissatisfaction, lost revenue, and damage to an organization’s reputation. Therefore, monitoring is an essential practice that enables organizations to keep their systems running smoothly and efficiently.
The Importance of Monitoring in DevOps
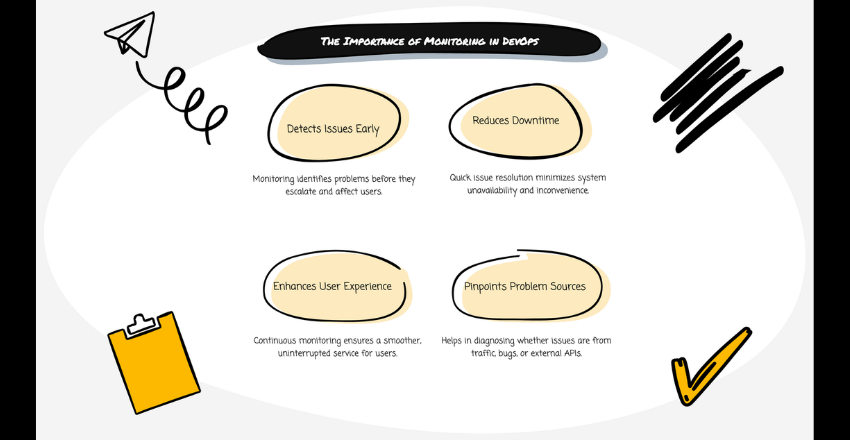
Monitoring isn’t an optional extra. It’s a fundamental part of maintaining a stable and efficient system. Without monitoring, you’re essentially flying blind. Issues can arise without warning, causing significant downtime and frustration.
Consider a typical scenario: Your application is running smoothly, but suddenly, users start experiencing slow load times. Without proper monitoring, it’s difficult to pinpoint the cause. Is it a spike in traffic? A memory leak? Or perhaps an external API issue? Monitoring provides the visibility needed to quickly identify and resolve such problems.
Example
Netflix is a great example. They heavily invest in monitoring and observability. This approach helps them detect issues early and ensure a seamless user experience. Their sophisticated monitoring setup allows them to anticipate problems and address them before they impact users.
How Monitoring Transforms Teams
Teams that prioritize monitoring can shift from being reactive to proactive. This shift has several benefits:
- Early Detection: Monitoring tools alert teams to potential issues before they become critical. This allows for early intervention.
- Improved Reliability: With continuous monitoring, systems are more reliable. Teams can ensure that applications perform as expected.
- Enhanced Efficiency: By identifying and addressing issues quickly, teams can focus on developing new features rather than firefighting.
Code Sample: Setting Up Basic Monitoring
Let’s look at a simple example using Prometheus and Grafana. These tools are widely used for monitoring and visualization.
First, set up Prometheus:
# prometheus.yml
global:
scrape_interval: 15s

scrape_configs:
- job_name: 'node_exporter'
static_configs:
- targets: ['localhost:9100']
Next, install and run Node Exporter to expose system metrics:
wget https://github.com/prometheus/node_exporter/releases/download/v1.0.1/
node_exporter-1.0.1.linux-amd64.tar.gz
tar xvfz node_exporter-1.0.1.linux-amd64.tar.gz
cd node_exporter-1.0.1.linux-amd64
./node_exporter
Finally, set up Grafana to visualize these metrics:
docker run -d -p 3000:3000 –name=grafana grafana/grafana
With this setup, you can start monitoring system metrics and visualizing them in Grafana.
Common Monitoring Challenges and Solutions
While monitoring is essential, it’s not without challenges. Here are some common issues teams face and how to overcome them:
Data Overload

Collecting too much data can be overwhelming. In today’s environment, systems generate massive amounts of data. Log files, metrics, traces, and events can quickly accumulate, creating a deluge of information. This overload can make it difficult to identify what’s important and can obscure actionable insights.
Solution: Focus on Key Metrics
To manage data overload, it’s crucial to focus on key metrics that provide actionable insights. Here are some steps to streamline your data:
- Identify Critical Metrics: Determine which metrics are most critical to your application’s performance and user experience. These might include response times, error rates, and resource utilization.
- Use Aggregation and Filtering: Instead of logging every single event, aggregate data where possible. For example, you might aggregate log entries to show the number of occurrences of specific error types over time, rather than logging each error individually.
- Implement Sampling: For high-traffic applications, it might be sufficient to sample data instead of capturing every data point. This approach reduces the volume of data without losing visibility into trends and anomalies.
- Leverage AI and Machine Learning: Modern monitoring tools often include AI and machine learning capabilities to help identify patterns and anomalies in large datasets. These tools can highlight significant events and trends without requiring teams to sift through all the data manually.
Example: Optimizing Log Data with Elasticsearch
Elasticsearch is a powerful tool for managing log data. However, without proper configuration, it can quickly become overwhelmed. Here’s how to optimize it:
# logstash.conf
input {
file {
path => "/var/log/myapp/*.log"
start_position => "beginning"
}
}

filter {
grok {
match => { "message" => "%{COMBINEDAPACHELOG}" }
}
date {
match => [ "timestamp" , "dd/MMM/yyyy:HH:mm:ss Z" ]
}
}

output {
elasticsearch {
hosts => ["localhost:9200"]
index => "myapp-logs-%{+YYYY.MM.dd}"
}
stdout { codec => rubydebug }
}
This configuration ensures that logs are parsed and structured correctly, making it easier to filter and aggregate data.

Alert Fatigue
Too many alerts can desensitize teams. When monitoring systems generate excessive alerts, it can lead to alert fatigue, where team members become desensitized and start ignoring notifications. This can result in critical alerts being missed, leading to significant issues going undetected.
Solution: Use Alerting Thresholds and Prioritize Critical Alerts
To combat alert fatigue, it’s important to refine your alerting strategy. Here’s how:
- Set Thresholds: Establish thresholds for alerts to ensure that only significant events trigger notifications. For example, set an alert for CPU usage only if it exceeds 80% for more than 5 minutes.
- Prioritize Alerts: Categorize alerts based on their severity and impact. Use different channels for different levels of alerts (e.g., email for low-priority alerts and SMS or phone calls for critical alerts).
- Use Deduplication and Correlation: Implement systems that can deduplicate alerts (so you’re not notified multiple times for the same issue) and correlate related alerts to provide a clearer picture of what’s happening.
- Regularly Review and Adjust: Regularly review your alerts and adjust them based on past experiences and evolving system behavior. Remove obsolete alerts and refine thresholds as necessary.
Example: Configuring Alerting in Prometheus
Here’s an example of setting up alerting rules in Prometheus to avoid alert fatigue:
# alert.rules
groups:
- name: example
rules:
- alert: HighCPUUsage
expr: 100 - (avg by (instance) (rate(node_cpu_seconds_total{mode="idle"}[1m])) * 100) > 80
for: 5m
labels:
severity: critical
annotations:
summary: "High CPU usage detected"
description: "CPU usage is above 80% for more than 5 minutes"
- alert: HighMemoryUsage
expr: node_memory_MemAvailable_bytes / node_memory_MemTotal_bytes * 100 < 20
for: 10m
labels:
severity: warning
annotations:
summary: "High Memory Usage"
description: "Available memory is less than 20% for more than 10 minutes"
This configuration ensures that only significant CPU and memory usage issues trigger alerts, reducing noise and focusing attention on critical issues.
Integration Complexity
Integrating monitoring tools can be complex. Many organizations use a variety of tools and platforms, each with its own setup and configuration requirements. This can make it challenging to achieve a cohesive monitoring strategy.
Solution: Use Standardized Tools and Frameworks
To simplify integration, consider the following approaches:
- Adopt Standardized Tools: Use widely-adopted monitoring tools and frameworks that are known for their integration capabilities. Tools like Prometheus, Grafana, and ELK (Elasticsearch, Logstash, Kibana) stack are good examples.
- Utilize APIs and Webhooks: Many monitoring tools offer APIs and webhooks for integration. Leverage these to connect different systems and automate data flows.
- Containerize Monitoring Tools: Use containerization to standardize the deployment and configuration of monitoring tools. Tools like Docker and Kubernetes can help manage monitoring tools consistently across environments.
- Employ Configuration Management: Use configuration management tools like Ansible, Puppet, or Chef to automate the setup and maintenance of your monitoring infrastructure. This ensures consistency and reduces manual errors.
Example: Integrating Prometheus with Kubernetes
Integrating Prometheus with Kubernetes can streamline monitoring across your containerized applications. Here’s a basic setup:
# prometheus-deployment.yaml
apiVersion: apps/v1
kind: Deployment
metadata:
name: prometheus
spec:
replicas: 1
selector:
matchLabels:
app: prometheus
template:
metadata:
labels:
app: prometheus
spec:
containers:
- name: prometheus
image: prom/prometheus
ports:
- containerPort: 9090
volumeMounts:
- name: prometheus-config
mountPath: /etc/prometheus/
resources:
requests:
memory: "256Mi"
cpu: "500m"
limits:
memory: "512Mi"
cpu: "1"
volumes:
- name: prometheus-config
configMap:
name: prometheus-config
This deployment configuration sets up Prometheus in a Kubernetes cluster, making it easier to monitor containerized applications.
Proactive Monitoring
Proactive monitoring is about anticipating issues before they impact users. This approach involves continuous improvement and fine-tuning of monitoring strategies.
Example
Facebook uses a proactive monitoring approach. They continuously analyze performance metrics and user feedback to identify potential issues. This proactive stance helps them maintain high availability and performance.
Wrapping up
Ignoring monitoring in your DevOps practices is like driving a car with your eyes closed. It’s risky and can lead to disastrous outcomes. By prioritizing monitoring, teams can detect issues early, improve system reliability, and shift from reactive to proactive operations.
Effective monitoring transforms teams into proactive powerhouses. With the right tools and strategies, you can ensure a seamless and reliable user experience. Don’t let monitoring take a backseat.
Noah is an accomplished technical author specializing in Operations and DevOps, driven by a passion ignited during his tenure at eBay in 2000. With over two decades of experience, Noah shares his transformative knowledge and insights with the community.
Residing in a charming London townhouse, he finds inspiration in the vibrant energy of the city. From his cozy writing den, overlooking bustling streets, Noah immerses himself in the evolving landscape of software development, operations, and technology. Noah’s impressive professional journey includes key roles at IBM and Microsoft, enriching his understanding of software development and operations.
Driven by insatiable curiosity, Noah stays at the forefront of technological advancements, exploring emerging trends in Operations and DevOps. Through engaging publications, he empowers professionals to navigate the complexities of development operations with confidence.
With experience, passion, and a commitment to excellence, Noah is a trusted voice in the Operations and DevOps community. Dedicated to unlocking the potential of this dynamic field, he inspires others to embrace its transformative power.
 We use cookies to ensure that we give you the best experience on our website and show you relevant advertising. If you continue to use this site we will assume that you are happy with it. To find out more read our