


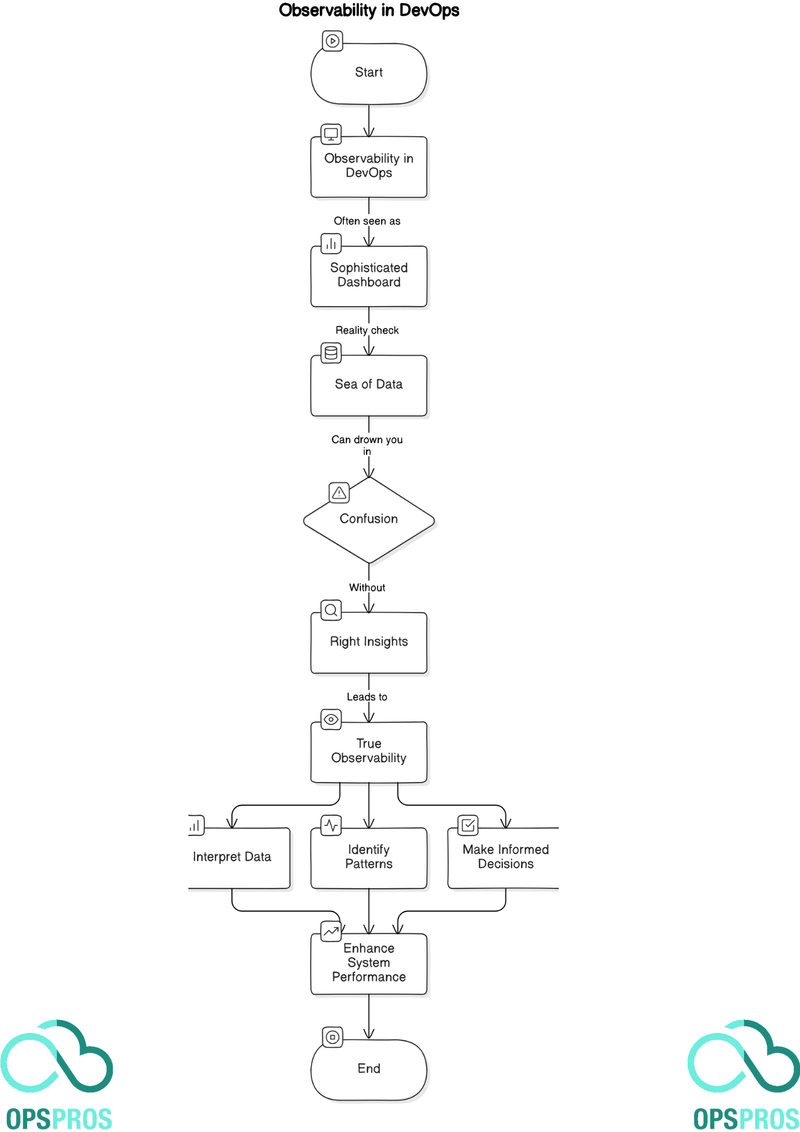
Observability in DevOps is often seen as a sophisticated dashboard filled with charts and metrics.
The reality check is that a sea of data can drown you in confusion without the right insights.
Over the years, I’ve found that true observability in DevOps emerges from your ability to interpret data, identify patterns, and make informed decisions that enhance system performance and reliability.
Understanding Observability in DevOps
Observability in DevOps is the ability to gain insights into the health and performance of complex distributed systems by analyzing the signals generated by various components. Unlike monitoring, which involves tracking predefined metrics, observability emphasizes the ability to ask ad hoc questions about the system’s behavior and identify issues that may not be immediately apparent.
Observability plays a crucial role in modern software development practices, as it enables teams to proactively identify and resolve issues before they impact end-users. By instrumenting code and collecting data from different sources such as logs, metrics, and traces, teams can gain a holistic view of their systems and detect anomalies in real-time.

The Three Pillars of Observability
Observability in DevOps is a critical practice that helps teams identify and resolve issues in complex, distributed systems. The three pillars of observability, logs, metrics, and traces, provide a comprehensive approach to monitoring and troubleshooting software systems.
Logs
Logs are a record of events that occur within a software system. They provide valuable information about system behavior, including errors, warnings, and informational messages. Logs are essential for troubleshooting, debugging, and auditing software systems.
Tools like ELK Stack and Splunk are commonly used for log analysis and management. They offer powerful search and filtering capabilities, as well as visualization and reporting features. With logs, DevOps teams can analyze user behavior, track system performance, and troubleshoot issues quickly.
Metrics
Metrics are quantitative measures of system behavior. They provide insights into system performance, including response times, error rates, and resource usage. Metrics are essential for capacity planning, performance tuning, and identifying performance bottlenecks.
Tools such as Prometheus and Graphite are commonly used for metric collection, analysis, and monitoring. They offer powerful graphing and alerting capabilities, as well as integration with other observability tools. With metrics, DevOps teams can monitor system health, troubleshoot performance issues, and optimize system performance.
Traces
Traces are a record of transactions that occur within a software system. They provide insights into system behavior, including transaction flow, service dependencies, and response times. Traces are essential for identifying issues in distributed systems and troubleshooting microservices architectures.
Tools like Jaeger and Zipkin are commonly used for trace collection, analysis, and monitoring. They offer visibility into distributed transactions, as well as integration with other observability tools. With traces, DevOps teams can troubleshoot issues in distributed systems, optimize service dependencies, and improve system performance.
Implementing Observability in DevOps
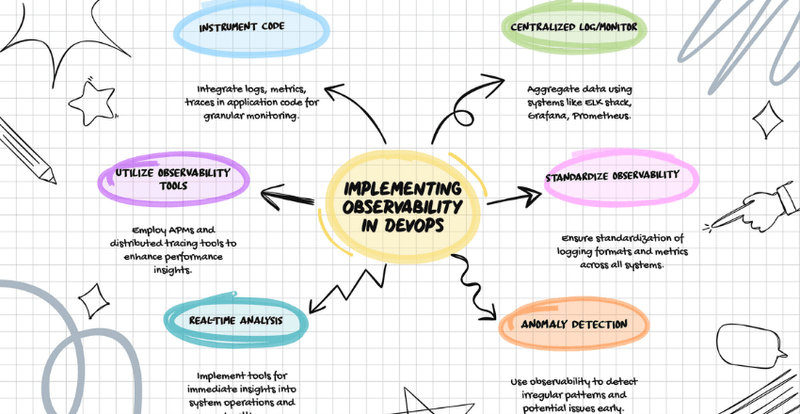
Implementing observability practices in a DevOps environment is essential for identifying and resolving issues in complex distributed systems. There are several best practices DevOps teams can follow to achieve observability.
Instrumenting Code
Instrumenting code involves adding custom code to application logs, metrics, and traces, allowing developers to monitor system behavior and identify issues. It’s crucial to include appropriate log messages, metric counters, and trace spans in code and ensure they are standardized across all systems.
Centralized Logging and Monitoring Systems
Centralized logging and monitoring systems are crucial for aggregating and analyzing observability data generated by applications, infrastructure, and other systems. DevOps teams should prioritize setting up centralized logging and monitoring systems such as Elasticsearch, Logstash, and Kibana (ELK) stack, Grafana, and Prometheus.
Leveraging Observability Tools
DevOps teams can leverage several observability tools to improve system observability. For instance, they can use APM tools, such as New Relic and Dynatrace, to monitor application performance, including response times, database queries, and error rates. Teams can also use distributed tracing tools, such as Zipkin and Jaeger, to analyze and optimize application performance across microservices architectures.
Overall, the key to implementing observability practices in a DevOps environment is having a clear strategy and the right tools in place. By instrumenting code, setting up centralized logging and monitoring systems, and leveraging observability tools, DevOps teams can achieve a high degree of observability, allowing them to detect and resolve issues quickly, leading to improved system reliability and performance.
Observability Tools and Technologies
Implementing observability practices requires leveraging a variety of tools and technologies. The following is a list of popular observability tools used in modern DevOps environments.
Prometheus: A metrics-based monitoring system that collects and stores time-series data and offers a query language for data analysis and alerting.
Grafana: A visualization and analysis tool used to display metrics and data from multiple sources. Grafana supports a variety of data sources, including Prometheus, Elasticsearch, and InfluxDB.
Jaeger: A distributed tracing system that offers visibility into the flow of requests through complex distributed systems.
ELK Stack: A combination of Elasticsearch, Logstash, and Kibana used for centralized logging and log analysis. Logstash is typically used to collect logs from multiple sources, Elasticsearch is used to index and store them, and Kibana is used to visualize and analyze the data.
Each of these tools offers unique features and advantages that can help teams improve their observability practices. For example, Grafana’s support for multiple data sources makes it a powerful visualization tool for displaying data from various observability systems. Similarly, Jaeger’s ability to trace requests across complex systems can help teams identify bottlenecks and performance issues more quickly.
While these tools are useful for implementing observability, it’s important to note that choosing the right set of tools and configuring them correctly can be a challenging task. Teams should carefully evaluate their needs and seek expert guidance to ensure they are using the right tools for the job.
Best Practices for Observability

Implementing observability practices in a DevOps environment can be challenging, but following best practices can help to ensure success. Here are some recommended best practices:
- Set meaningful alerts: Alerts are only useful if they are actionable. Be sure to configure alerts based on metrics that have clear thresholds and will indicate an actual issue. Avoid alert fatigue by setting up tiered alerting, so that only the most critical issues are flagged immediately.
- Leverage automated monitoring: Automate as much monitoring as possible, to reduce the risk of human error and ensure consistency. Be sure to include end-to-end monitoring, spanning all tiers of the applications and infrastructure, to provide complete observability.
- Use observability data proactively: Don’t simply react to issues as they occur; use observability data to proactively identify and address potential problems before they impact the system. Use advanced analytics and machine learning to gain deeper insights into system performance and predict potential issues.
By following these best practices, teams can achieve greater visibility and control over their DevOps environment, leading to more efficient and effective development practices.

Challenges and Limitations of Observability
While observability is a crucial component of modern DevOps practices, it is not without its challenges and limitations. Below are some of the most common challenges that teams may face when implementing observability practices, along with tips for overcoming them.
Data Overload
One of the main challenges of observability is the sheer volume of data that can be generated from modern software systems. With so much data being collected from logs, metrics, and traces, it can be difficult for teams to process and analyze all of it effectively.
To overcome this challenge, teams should focus on collecting only the most relevant data. This means using thoughtful logging and monitoring practices and setting up alerts for only the most critical issues. Teams should also invest in tools that can help automate data analysis and identify patterns and anomalies in the data.
Scalability Concerns
As software systems become more complex and distributed, scalability can become a challenge for observability practices. It can be difficult to collect and analyze data from systems that span multiple environments and technologies.
To address scalability concerns, teams should develop a clear strategy for scaling their observability practices alongside their software systems. This may involve investing in tools that are designed for distributed systems and implementing standard logging and monitoring practices across all environments.
Cross-Domain Collaboration
Effective observability often requires collaboration between teams with different areas of expertise. For example, developers may need to work closely with operations teams to ensure that observability tools are properly configured and integrated with the software stack.
To overcome this challenge, teams should invest in cross-domain training and collaboration practices. This may involve establishing shared metrics and logging practices, implementing regular code reviews, and ensuring that team members have a solid understanding of the entire software stack.
Observability in Agile Development

Observability is an essential practice for modern software development, and its benefits extend to Agile development methodologies. By integrating observability practices into Agile workflows, teams can enhance their ability to deliver high-quality software quickly and efficiently.
The iterative nature of Agile development, with its sprints and continuous integration, makes it well-suited to observability practices. By instrumenting code to generate logs, metrics, and traces, development teams can gain deep insights into the performance of their applications, identify issues early, and respond faster to changes.
Observability also supports collaboration within Agile teams and across domains. By providing a shared view of application performance, observability data can help teams identify areas where optimization is needed, and work together to deliver better software.
Implementing observability in Agile development requires a focus on key areas, such as setting meaningful alerts, using automated monitoring, and leveraging observability data proactively. By prioritizing these practices, Agile teams can benefit from the full potential of observability.
The integration of observability in Agile development is increasingly seen as an essential practice for any organization that wants to deliver high-quality software faster. As such, it is important to stay up-to-date with the latest trends and best practices in this area, and continue to evolve observability practices alongside Agile development methodologies.
Final Thoughts
Observability is a critical aspect of modern software development practices, especially in the context of DevOps. By providing real-time insights into complex distributed systems, observability makes it easier to identify and resolve issues before they impact end-users. It also helps teams optimize their systems for better performance and reliability.
James is an esteemed technical author specializing in Operations, DevOps, and computer security. With a master’s degree in Computer Science from CalTech, he possesses a solid educational foundation that fuels his extensive knowledge and expertise. Residing in Austin, Texas, James thrives in the vibrant tech community, utilizing his cozy home office to craft informative and insightful content. His passion for travel takes him to Mexico, a favorite destination where he finds inspiration amidst captivating beauty and rich culture. Accompanying James on his adventures is his faithful companion, Guber, who brings joy and a welcome break from the writing process on long walks.
With a keen eye for detail and a commitment to staying at the forefront of industry trends, James continually expands his knowledge in Operations, DevOps, and security. Through his comprehensive technical publications, he empowers professionals with practical guidance and strategies, equipping them to navigate the complex world of software development and security. James’s academic background, passion for travel, and loyal companionship make him a trusted authority, inspiring confidence in the ever-evolving realm of technology.
 We use cookies to ensure that we give you the best experience on our website and show you relevant advertising. If you continue to use this site we will assume that you are happy with it. To find out more read our