


Neglecting the role of monitoring and feedback loops in continuous deployment is like navigating a ship without a compass. I’ve seen companies drift off-course, resulting in unnecessary detours and inefficiencies. Integrating constant monitoring and immediate feedback into your continuous deployment pipeline serves as your true north, guiding you towards efficient and effective deployments.

Continuous Monitoring in Continuous Deployment
Definition and Importance
Continuous monitoring in DevOps refers to the automated process of collecting, analyzing, and acting on data from various stages of the software delivery pipeline. It provides end-to-end visibility into the performance and health of applications, infrastructure, and the deployment process itself. Continuous monitoring is essential for maintaining the reliability and stability of the production environment, especially given the frequent code changes characteristic of continuous deployment.
Key Benefits
Early Detection and Issue Resolution: Continuous monitoring allows teams to identify potential bottlenecks, vulnerabilities, or performance issues early in the development cycle. This enables timely resolution, preventing further complications and minimizing the impact on end-users.
Enhanced Visibility and Transparency: By monitoring various aspects of the software development process, such as code quality, system performance, and security, teams gain visibility into the health and progress of their projects. This transparency fosters accountability, facilitates informed decision-making, and helps align development efforts with organizational goals.
Reduction in System Downtime: Continuous monitoring helps in acting immediately on application performance issues before they cause system downtime and service outages, thereby maintaining a glitch-free operational environment.
Risk Management: Continuous monitoring provides a means to control risks by offering a feedback mechanism for the health of the application release, the pipeline, and the infrastructure. This includes early detection of performance bottlenecks and better prediction of code behavior.
Implementation Strategies
Automated Tools
Utilizing tools that are flexible across different environments (on-premise, cloud, containerized ecosystems) is crucial for comprehensive monitoring and feedback. These tools ensure that every system is continuously observed, irrespective of the deployment environment.
Example 1: Prometheus for Monitoring
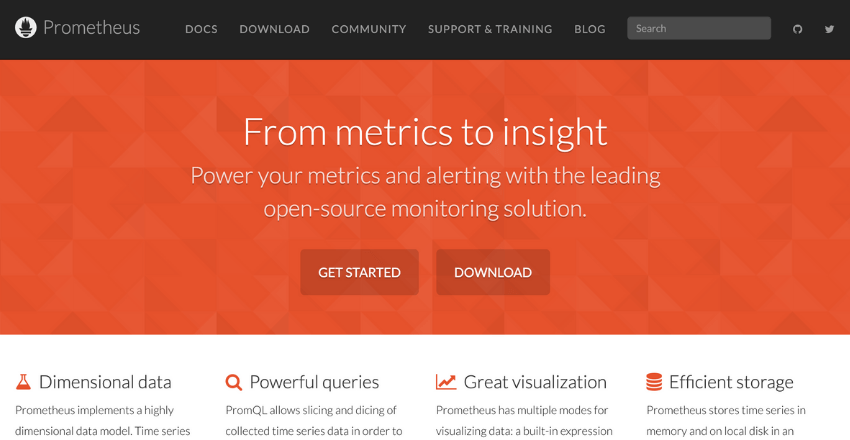
Prometheus is an open-source monitoring tool designed for reliability and scalability. It works well across various environments, including on-premise and cloud. Prometheus scrapes metrics from instrumented jobs, stores them efficiently, and allows for powerful queries. Its alerting mechanism integrates with various notification systems like Slack, PagerDuty, or email.
For instance, a cloud-based microservices application can use Prometheus to monitor service health, latency, and throughput, ensuring that performance metrics are continuously tracked and anomalies are promptly detected.
Example 2: Datadog for Comprehensive Observability
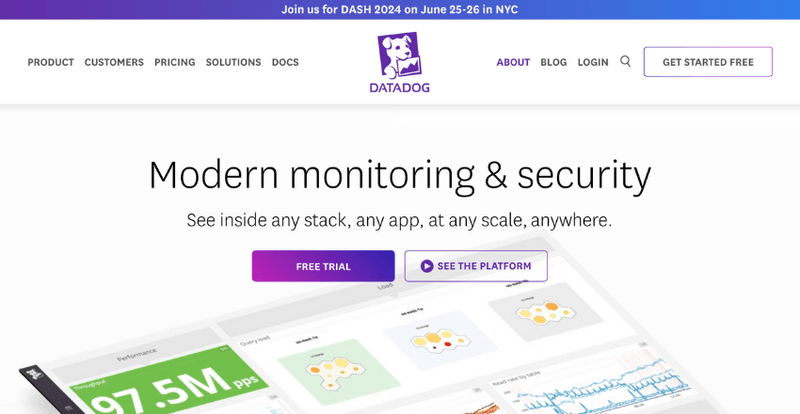
Datadog is a SaaS-based monitoring and analytics platform that offers end-to-end visibility across on-premise, cloud, and hybrid environments. It integrates with over 400 technologies, providing a unified view of metrics, traces, and logs. Datadog’s real-time dashboards and customizable alerts help teams quickly identify and resolve issues.
For example, a containerized application running on Kubernetes can leverage Datadog to monitor pod health, resource usage, and network performance, ensuring that the entire infrastructure is continuously observed.
Data Aggregation and Analysis
Implementing a continuous monitoring data layer that includes log event streams, health checks, and continuous monitoring agents is essential for collecting and analyzing data. This layer aggregates information and sends it to an event aggregation server for further processing.
Example 1: ELK Stack for Log Aggregation

The ELK stack (Elasticsearch, Logstash, Kibana) is a powerful solution for aggregating and analyzing log data. Logstash collects and processes log events from multiple sources, Elasticsearch indexes and stores this data, and Kibana provides visualization capabilities. Implementing the ELK stack, teams can centralize their log data, making it easier to search, analyze, and visualize.
For instance, a web application might use ELK to aggregate logs from various servers and services, enabling the team to monitor user activity, track errors, and identify performance bottlenecks.
Example 2: Splunk for Data Analysis

Splunk is a platform for searching, monitoring, and analyzing machine-generated data. It collects data from various sources, including logs, metrics, and network traffic, and provides powerful analytics and visualization tools. Splunk’s ability to handle large volumes of data makes it ideal for real-time monitoring and historical analysis. For example, an e-commerce platform can use Splunk to analyze transaction logs, detect fraudulent activities, and optimize the user experience by identifying and resolving issues quickly.
Alert Systems
Setting up alert systems that provide real-time notifications to the response team is vital for rapid incident response and minimizing operational issues and security threats.
Example 1: PagerDuty for Incident Management
PagerDuty is an incident management platform that helps teams respond to critical issues quickly. It integrates with monitoring tools like Prometheus, Datadog, and Splunk to receive alerts and trigger incident workflows.
PagerDuty’s on-call scheduling and escalation policies ensure that the right people are notified at the right time. For example, if a server goes down, Prometheus can detect the issue and send an alert to PagerDuty, which then notifies the on-call engineer via SMS, email, or phone call, ensuring a swift response.
Example 2: Opsgenie for Alerting and Incident Response
Opsgenie is another popular alerting and incident management tool. It integrates with various monitoring and logging tools to provide real-time alerts and automate incident response processes. Opsgenie’s flexible routing rules and on-call schedules ensure that alerts reach the appropriate team members.
For instance, in a DevOps setup, if a database performance issue is detected by Datadog, Opsgenie can alert the database administrators, who can then investigate and resolve the issue before it affects end-users.
Implementing effective monitoring and feedback mechanisms in continuous deployment requires the strategic use of automated tools, data aggregation and analysis platforms, and robust alert systems. Automated tools like Prometheus and Datadog provide comprehensive monitoring across various environments, ensuring that every system is continuously observed.
Data aggregation and analysis solutions such as the ELK stack and Splunk centralize and process vast amounts of data, enabling teams to gain insights and make informed decisions. Alert systems like PagerDuty and Opsgenie ensure that incidents are promptly addressed, minimizing downtime and maintaining operational efficiency.

Continuous Feedback Loops in Continuous Deployment
Definition and Importance
Continuous feedback loops in DevOps involve the systematic collection and analysis of feedback from various stages of the software development and deployment lifecycle. This feedback is crucial for driving continuous improvement, enhancing collaboration, and ensuring that the software meets quality standards and user expectations.
Key Benefits
Faster Issue Detection: Feedback loops enable rapid identification and resolution of issues, reducing the impact on users and improving the overall quality of the software.
Enhanced Collaboration: Teams collaborate effectively when they share feedback, leading to improved communication and problem-solving. This is particularly important in a DevOps environment where development and operations teams need to work closely together.
Customer-Centric Development: Feedback from end-users and stakeholders informs future development cycles, ensuring that the software better meets customer needs and expectations.
Continuous Improvement: Feedback acts as a catalyst for continuous improvement, driving iterative enhancements across the software development lifecycle. This includes learning from experiences and implementing necessary changes to avoid future pitfalls.
Implementation Strategies
Collaboration Tools
Utilizing collaboration tools and platforms that facilitate feedback sharing among cross-functional teams is crucial for maintaining effective communication and ensuring that feedback is actionable and leads to continuous improvement.
Example 1: Slack for Real-Time Communication

Slack is a powerful tool that enables real-time communication among team members. By creating dedicated channels for different aspects of the deployment process—such as #deployment-updates, #bug-reports, and #performance-monitoring—teams can ensure that relevant information is shared promptly and reaches the right audience.
Integrating Slack with other tools like Jenkins or GitHub can automate notifications, ensuring that every commit, build, or deployment triggers a message in the relevant channel. This immediate dissemination of information helps keep everyone on the same page and fosters a culture of transparency and rapid response.
Example 2: Jira for Issue Tracking and Management
Jira is another essential tool that helps in tracking issues, managing projects, and facilitating collaboration. Teams can use Jira to log and track bugs, feature requests, and tasks. By integrating Jira with continuous integration and deployment (CI/CD) tools, issues detected during monitoring can be automatically logged and assigned to the appropriate team members.
This integration ensures that no issue is overlooked and that each is tracked through to resolution. Jira’s dashboards and reporting features also provide visibility into the status of ongoing projects, helping teams prioritize work and allocate resources effectively.
Example 3: Confluence for Documentation and Knowledge Sharing
Confluence is a collaborative workspace where teams can create, share, and update documentation. By maintaining comprehensive documentation on deployment processes, incident responses, and best practices, teams can ensure that knowledge is shared and accessible. Confluence allows for real-time editing and commenting, enabling team members to contribute their insights and updates directly.
This collaborative approach to documentation ensures that all team members have access to the latest information and can learn from past experiences, ultimately improving the deployment process.
Data Analysis
Implementing data analysis and visualization techniques to extract insights from feedback data is essential for enabling data-driven decision-making. This approach helps teams understand trends, identify patterns, and make informed improvements.
Example 1: Using ELK Stack for Log Analysis

The ELK stack (Elasticsearch, Logstash, Kibana) is a powerful suite of tools for analyzing log data. Logstash collects and processes logs, Elasticsearch indexes and stores this data, and Kibana provides visualization capabilities. By leveraging ELK, teams can aggregate logs from various sources, enabling comprehensive analysis of application performance, error rates, and user behaviors.
Kibana’s dashboards allow teams to visualize this data, making it easier to identify trends and anomalies. For example, a spike in error rates might be visualized as a sharp increase on a Kibana graph, prompting immediate investigation and resolution.
Example 2: Grafana for Metric Visualization
Grafana is a popular open-source platform for monitoring and observability, capable of creating dynamic and interactive dashboards. By integrating Grafana with Prometheus, teams can visualize metrics in real-time, gaining insights into system performance and resource utilization.
Grafana’s alerting features can notify teams when metrics exceed predefined thresholds, enabling proactive management of potential issues. For instance, if CPU usage suddenly spikes, an alert can be triggered, prompting the team to investigate and mitigate the issue before it impacts users.
Example 3: Power BI for Business Intelligence
Microsoft Power BI is a robust business analytics tool that allows teams to create interactive reports and dashboards. By connecting Power BI to various data sources, including application performance monitoring tools, teams can analyze and visualize feedback data in a business context.
This integration helps in translating technical metrics into business insights, such as understanding how performance issues affect user engagement or revenue. Power BI’s data modeling capabilities enable teams to combine different data sets, providing a holistic view of the deployment process and its impact on business objectives.
Effective implementation of collaboration tools and data analysis techniques is vital for harnessing the full potential of feedback mechanisms in continuous deployment.
Collaboration tools like Slack, Jira, and Confluence ensure that information flows seamlessly among team members, fostering a culture of transparency and rapid response. Data analysis tools like ELK stack, Grafana, and Power BI enable teams to transform raw feedback data into actionable insights, driving continuous improvement and informed decision-making.
Synergy of Continuous Monitoring and Feedback
The true power of continuous monitoring and feedback lies in their synergy. When integrated effectively, they form a virtuous cycle that drives continuous improvement in DevOps.
Continuous monitoring provides the necessary data and insights that fuel feedback loops, enabling teams to make informed decisions, identify areas for improvement, and measure the impact of their changes. Conversely, feedback provides valuable context and user perspectives that shape the design and implementation of monitoring strategies, ensuring the right metrics are captured and analyzed.
Table: Monitoring and Feedback Tools Comparison
| Tool | Continuous Monitoring Features | Continuous Feedback Features |
|---|---|---|
| Prometheus | Time-series data, alerting, flexible queries | Integration with Grafana for visual feedback |
| Grafana | Visualization, alerting, dashboards | Rich data visualization, integration with multiple data sources |
| ELK Stack (Elasticsearch, Logstash, Kibana) | Log aggregation, searching, visualization | Feedback through dashboards and visualizations |
| Splunk | Real-time monitoring, log analysis, machine learning | Comprehensive feedback and reporting |
| Datadog | Full-stack monitoring, alerting, dashboards | Integration with collaboration tools for feedback loops |
The Impact of Neglecting Monitoring and Feedback Loops
Ignoring the importance of continuous monitoring and feedback loops can lead to serious repercussions. I’ve seen firsthand how detrimental the absence of these practices can be.
Delayed Issue Detection
Without continuous monitoring, issues in the deployment pipeline may go unnoticed until they cause significant damage. This delay can result in prolonged downtime, frustrated users, and a tarnished reputation.
Example: Imagine a scenario where a critical bug is introduced into the codebase. Without proper monitoring, this bug might slip through the cracks and make its way into production. Users start experiencing crashes and glitches, but the development team remains unaware until customer complaints flood in. By the time the issue is identified, the damage is done—customers are frustrated, support teams are overwhelmed, and the company’s reputation takes a hit. This scenario could have been avoided with continuous monitoring, which would have detected the anomaly early, triggering alerts and allowing the team to address the issue before it escalated.
Reduced Collaboration
In the absence of feedback loops, teams may operate in silos, leading to miscommunication and misaligned goals. This fragmentation can hinder the overall progress and efficiency of the deployment process.
Example: Consider a development team and an operations team working on the same project but without effective feedback mechanisms. The development team might deploy new features without fully understanding the operational impact, while the operations team struggles to manage these changes without insight into the development process. This disconnect leads to frequent clashes, misaligned priorities, and a lack of cohesive strategy. Feedback loops, on the other hand, facilitate open communication and collaboration, ensuring that both teams work towards common goals and understand each other’s challenges and contributions.
Increased Risk
Lack of monitoring and feedback increases the risk of undetected vulnerabilities and performance bottlenecks. This oversight can compromise the security and reliability of the application, potentially leading to data breaches and system failures.
Example: In a financial application, security is paramount. Without continuous monitoring, a subtle vulnerability in the code might remain undetected. Hackers exploit this weakness, leading to a data breach that exposes sensitive customer information.
The fallout includes financial losses, legal consequences, and a severe blow to the company’s credibility. Continuous monitoring would have identified the unusual patterns indicative of a security breach, allowing the team to respond swiftly and mitigate the threat before any real damage occurred.
Inefficient Development
Neglecting feedback can result in a development process that fails to meet user needs and expectations. This misalignment can lead to wasted resources and time, as teams may need to backtrack and rework significant portions of the application.
Example: A company launches a new feature in its mobile app, but fails to collect and analyze user feedback. The feature, while technically impressive, doesn’t resonate with users and leads to a drop in app engagement. The development team, unaware of the users’ dissatisfaction, continues to build on this feature, investing time and resources.
Months later, after significant development, they realize the feature needs a complete overhaul based on negative user feedback. Had there been a continuous feedback loop, the team could have iterated on the feature early on, aligning it with user expectations and saving substantial time and effort.
In essence, neglecting continuous monitoring and feedback loops is a risky proposition that can lead to delayed issue detection, reduced collaboration, increased risk, and inefficient development.
Implementing these practices is not just about improving processes—it’s about safeguarding the reliability, security, and success of your deployments. By maintaining vigilant monitoring and fostering open feedback channels, organizations can navigate the complexities of continuous deployment with confidence and agility.

Final Thoughts
In continuous deployment, the role of monitoring and feedback loops cannot be overstated. They are the compass guiding your ship, ensuring you stay on course amidst the rapid changes and challenges of modern software development. By embracing continuous monitoring and integrating feedback loops, you can achieve faster issue detection, enhanced collaboration, customer-centric development, and continuous improvement.
Neglecting these critical components is like sailing blind, risking unnecessary detours and inefficiencies. Instead, let continuous monitoring and feedback loops steer you towards a successful, efficient, and effective deployment process. Your organization will benefit from reduced downtime, improved quality, and higher user satisfaction.
Noah is an accomplished technical author specializing in Operations and DevOps, driven by a passion ignited during his tenure at eBay in 2000. With over two decades of experience, Noah shares his transformative knowledge and insights with the community.
Residing in a charming London townhouse, he finds inspiration in the vibrant energy of the city. From his cozy writing den, overlooking bustling streets, Noah immerses himself in the evolving landscape of software development, operations, and technology. Noah’s impressive professional journey includes key roles at IBM and Microsoft, enriching his understanding of software development and operations.
Driven by insatiable curiosity, Noah stays at the forefront of technological advancements, exploring emerging trends in Operations and DevOps. Through engaging publications, he empowers professionals to navigate the complexities of development operations with confidence.
With experience, passion, and a commitment to excellence, Noah is a trusted voice in the Operations and DevOps community. Dedicated to unlocking the potential of this dynamic field, he inspires others to embrace its transformative power.
 We use cookies to ensure that we give you the best experience on our website and show you relevant advertising. If you continue to use this site we will assume that you are happy with it. To find out more read our