


Ever wondered why your system fails at the worst possible moment? Why your DevOps team looks stressed and overworked? Thinking that Site Reliability Engineering (SRE) is optional in DevOps operations is a misconception.
This oversight often results in unstable systems, disappointing end-user experiences, and a burdened DevOps team. I’ve seen how embracing SRE transforms the way they manage system reliability.

The Heart of Site Reliability Engineering (SRE)
What is SRE?
Site Reliability Engineering (SRE) is a discipline that combines software engineering and IT operations to ensure the reliability, availability, and performance of software systems. It originated at Google, coined by Ben Treynor Sloss, and has since become a critical component of modern DevOps practices.
SRE bridges the gap between development and operations, applying software engineering principles to solve operational problems. This approach leads to more reliable systems and happier end-users.
Key Concepts of SRE
Role and Responsibilities
SREs are responsible for the reliability and scalability of systems. They ensure that new features don’t compromise system stability by:
- Automating tasks
- Managing system performance
- Bridging the gap between development and operations
This holistic role ensures that systems are both robust and scalable.
Automation and Standardization
One of the core tenets of SRE is treating operations as a software problem. This means automating repetitive tasks and standardizing processes to reduce human error and increase efficiency.
Common Tools:
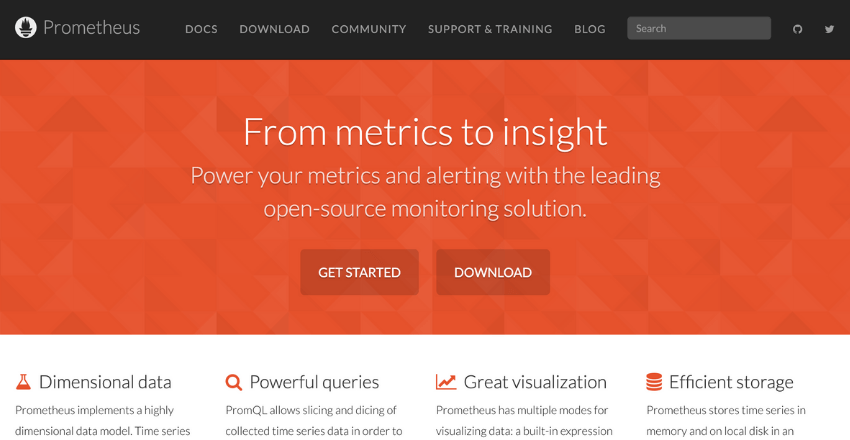
Prometheus and Grafana: For monitoring
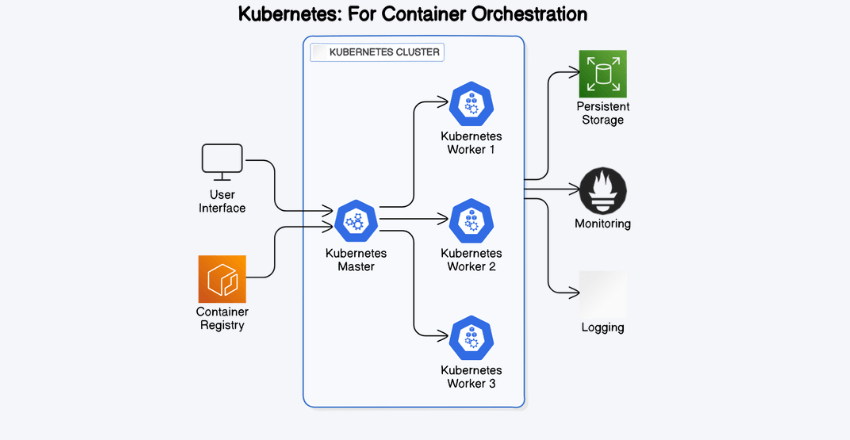
Kubernetes: For container orchestration
Automation helps in managing large-scale systems efficiently, freeing up human resources for more complex tasks.
Service Level Objectives (SLOs) and Error Budgets
SREs use SLOs to define the desired reliability of a system. These objectives are based on Service Level Indicators (SLIs), which measure specific aspects of service performance, such as latency and error rates.
An error budget is the maximum allowable threshold for errors and downtime, balancing the need for new features with system reliability.
Example Table:
| Metric | Definition | Example |
|---|---|---|
| SLI | Measures specific performance | Latency, error rate |
| SLO | Desired reliability | 99.9% uptime |
| Error Budget | Max allowable errors/downtime | 0.1% downtime per month |
Incident Management
Incident management is a crucial part of SRE. SREs respond to outages, conduct post-incident reviews, and implement measures to prevent future incidents.
This involves:
- Debugging infrastructure issues
- Ensuring quick recovery from failures
SRE vs. DevOps: Understanding the Differences
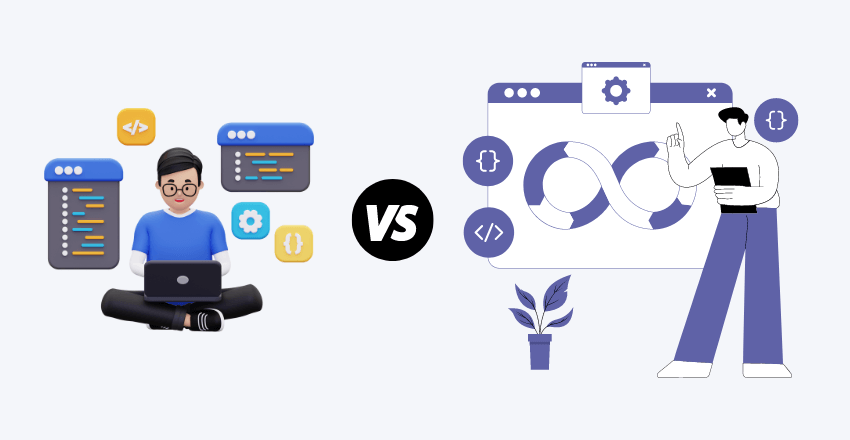
The main difference between SRE and DevOps is what they focus on. SRE (Site Reliability Engineering) concentrates on making sure the production environment is stable and runs smoothly. DevOps looks at the whole application process from start to finish. Businesses don’t have to pick one over the other; they can use both together to work better.
While SRE and DevOps share many similarities, there are key differences in their focus and implementation.
Focus
- DevOps: Emphasizes continuous integration and continuous delivery (CI/CD), aiming to speed up the development process and improve collaboration between development and operations teams.
- SRE: Focuses on reliability, scalability, and performance of systems, ensuring they handle production workloads without failure.
Tools and Practices
- DevOps: Uses tools like Jenkins for CI/CD, JIRA for change management, and GitHub for version control.
- SRE: Utilizes monitoring tools like Prometheus and Grafana, incident management tools like PagerDuty, and automation tools like Ansible and Kubernetes.
Metrics
- DevOps: Measures performance using metrics like deployment frequency and deployment failure rate.
- SRE: Uses SLOs, SLIs, and error budgets to measure and manage system reliability.
Incident Handling
- DevOps: Focuses on mitigating issues and improving the development process based on incident feedback.
- SRE: Conducts thorough post-incident reviews to identify root causes and implement long-term solutions to prevent recurrence.
Why SRE is Not Optional
The belief that SRE is optional can lead to significant issues:
- Unstable Systems: Without SRE, systems may frequently crash or underperform, leading to a poor user experience.
- Disappointing End-User Experiences: When systems are unreliable, users get frustrated and may abandon the service.
- Burdened DevOps Teams: DevOps teams without SRE are often overworked, constantly firefighting instead of focusing on innovation.
The Real-World Impact of SRE
I’ve seen firsthand how implementing SRE practices transforms DevOps operations. In one project, we reduced downtime by 70% within six months. This was achieved through:
Automated Monitoring
Automated monitoring is crucial for maintaining system reliability. By using tools like Prometheus and Grafana, we can set up real-time alerts and dashboards that track system performance metrics. Here’s a code sample to set up Prometheus monitoring for a web application:
# prometheus.yml
global:
scrape_interval: 15s

scrape_configs:
- job_name: 'my-web-app'
static_configs:
- targets: ['localhost:9090']
In this configuration, Prometheus scrapes metrics from the web application every 15 seconds. We can then visualize these metrics in Grafana to monitor application performance.
Example: In the project, we set up Prometheus to monitor key metrics such as CPU usage, memory usage, and response times. Alerts were configured to notify the team if any metric exceeded predefined thresholds, allowing us to address potential issues before they impacted users.
# Alerting rule example
groups:
- name: example
rules:
- alert: HighCPUUsage
expr: sum(rate(container_cpu_usage_seconds_total[1m])) by (container_name) > 0.85
for: 1m
labels:
severity: critical
annotations:
summary: "High CPU usage detected"
description: "CPU usage is above 85% for more than 1 minute."
This alerting rule triggers a critical alert if CPU usage exceeds 85% for more than a minute.
Incident Response Improvements
Improving incident response involves setting up clear protocols and ensuring rapid action when incidents occur. Using tools like PagerDuty can streamline this process.
Example: We implemented a structured incident response protocol with defined roles. For instance, the Incident Commander (IC) oversees the entire process, while Subject Matter Experts (SMEs) address specific technical issues. Here’s an example of a simplified incident response playbook:
- Detection: Alert received via Prometheus and PagerDuty.
- Triage: IC assesses the severity and impact of the incident.
- Response: SMEs diagnose and fix the issue.
- Communication: Regular updates are provided to stakeholders.
- Resolution: Issue is resolved and systems are restored.
- Post-Incident Review: Conduct a blameless post-mortem to analyze the root cause.
Example Code: Using a combination of Prometheus for detection and PagerDuty for alerting.
# PagerDuty integration with Prometheus
alerting:
alertmanagers:
- static_configs:
- targets:
- 'localhost:9093'

receivers:
- name: 'pagerduty'
pagerduty_configs:
- service_key: '<PAGERDUTY_SERVICE_KEY>'
With this setup, alerts from Prometheus are sent to PagerDuty, ensuring the right team members are notified immediately.
Rigorous Post-Incident Analysis
After an incident is resolved, conducting a post-incident review is essential to prevent recurrence. These reviews should be blameless and focus on understanding what went wrong and how to improve.
Example: In our project, after resolving a significant database outage, we conducted a detailed post-incident review. We identified that a surge in traffic led to the database becoming overwhelmed. The review process included:
- Timeline: Documenting the sequence of events leading up to and during the incident.
- Root Cause Analysis: Using the “Five Whys” technique to drill down to the underlying cause.
- Action Items: Listing actionable steps to prevent similar incidents in the future, such as implementing auto-scaling for the database and optimizing queries.
Example Post-Incident Report:
# Post-Incident Review: Database Outage

## Summary
On [Date], our primary database experienced an outage due to an unexpected surge in traffic. The incident lasted for approximately 30 minutes.

## Timeline
- **12:00 PM:** Alert triggered for high database CPU usage.
- **12:05 PM:** Incident response initiated.
- **12:15 PM:** Identified high traffic as the cause.
- **12:20 PM:** Implemented temporary traffic throttling.
- **12:30 PM:** Database performance stabilized.

## Root Cause Analysis
**Why did the database fail?** High CPU usage.
**Why was there high CPU usage?** Surge in traffic.
**Why was there a surge in traffic?** Promotional campaign led to increased user activity.
**Why was the database unable to handle the surge?** Lack of auto-scaling.
**Why was auto-scaling not implemented?** Oversight in capacity planning.

## Action Items
- Implement auto-scaling for the database.
- Optimize database queries.
- Review capacity planning procedures.

## Lessons Learned
- Importance of proactive capacity planning.
- Need for automated scaling solutions.
This rigorous approach not only improved system reliability but also boosted team morale and productivity. Team members felt more confident in their ability to handle incidents and appreciated the structured, supportive approach to post-incident analysis.

SRE: A Step-by-Step Guide
Step 1: Adopt an SRE Mindset
The first step in embracing Site Reliability Engineering (SRE) is shifting your team’s mindset. View operations not as a set of manual tasks but as a software problem. This approach changes how your team approaches daily tasks, encouraging them to find scalable, automated solutions rather than relying on manual processes.
Example: Imagine your team spends a significant amount of time on server maintenance. Traditionally, this might involve logging into each server, applying updates, and rebooting. With an SRE mindset, you’d instead create a script to automate these tasks. This not only saves time but also reduces human error. Over time, these scripts can evolve into more sophisticated tools that handle a variety of maintenance tasks, freeing your team to focus on more strategic initiatives.
Step 2: Define and Track SLOs and Error Budgets

Service Level Objectives (SLOs) and Error Budgets are core to SRE. SLOs are the desired reliability metrics for your system, based on Service Level Indicators (SLIs) like latency, throughput, and error rate. Error Budgets define the acceptable amount of downtime or errors, helping to balance new feature deployment with system reliability.
Example: Suppose your application promises 99.9% uptime. This translates to about 43 minutes of allowable downtime per month. By tracking this, you can prioritize incident response when you approach this threshold. Regularly reviewing these metrics helps in making informed decisions about deploying new features or focusing on stability improvements.
Step 3: Invest in Automation Tools
Automation is a cornerstone of SRE. Invest in tools that help manage and scale your operations efficiently. Prometheus is excellent for monitoring, while Kubernetes handles container orchestration, ensuring your applications run smoothly across different environments.
Example: Your team might use Prometheus to set up monitoring dashboards that track key performance indicators. Alerts can be configured to notify your team when certain thresholds are breached, allowing for proactive issue resolution. Kubernetes can automate deployment, scaling, and management of containerized applications, ensuring consistent performance and simplifying rollback in case of failure.
Step 4: Build a Robust Incident Management Process
A robust incident management process is essential for quickly addressing and learning from outages. This involves clearly defined roles, rapid response mechanisms, and thorough post-incident reviews.
Example: Create an incident response playbook that outlines steps for various types of incidents, such as a database outage or a network failure. Assign specific roles like Incident Commander, Communication Lead, and Technical Lead. After resolving an incident, conduct a blameless post-mortem to identify root causes and implement preventive measures. For instance, if a database outage was due to increased traffic, you might implement auto-scaling or improve query optimization.
Step 5: Foster Collaboration Between Teams
Collaboration between development and operations teams is vital. SREs act as a bridge, ensuring both teams work towards common goals of system reliability and performance.
Example: Implement regular sync meetings between DevOps and development teams to discuss upcoming features, potential risks, and reliability improvements. Use tools like JIRA for tracking cross-team tasks and facilitating transparency. Encourage a culture of shared responsibility where developers are involved in incident response and operational improvements, promoting a holistic view of the system’s health.
Wrapping up
Site Reliability Engineering is not optional in modern DevOps operations. Ignoring it can lead to unstable systems, poor user experiences, and overwhelmed teams. By adopting SRE principles, you can transform your DevOps practices, leading to more reliable systems and happier teams.
Ready to embrace SRE and see these benefits in your organization? Start by adopting the mindset, defining SLOs, investing in automation, and building robust incident management processes. Your systems—and your users—will thank you.
Still have questions, please send us a message on here and will be to help you.
James is an esteemed technical author specializing in Operations, DevOps, and computer security. With a master’s degree in Computer Science from CalTech, he possesses a solid educational foundation that fuels his extensive knowledge and expertise. Residing in Austin, Texas, James thrives in the vibrant tech community, utilizing his cozy home office to craft informative and insightful content. His passion for travel takes him to Mexico, a favorite destination where he finds inspiration amidst captivating beauty and rich culture. Accompanying James on his adventures is his faithful companion, Guber, who brings joy and a welcome break from the writing process on long walks.
With a keen eye for detail and a commitment to staying at the forefront of industry trends, James continually expands his knowledge in Operations, DevOps, and security. Through his comprehensive technical publications, he empowers professionals with practical guidance and strategies, equipping them to navigate the complex world of software development and security. James’s academic background, passion for travel, and loyal companionship make him a trusted authority, inspiring confidence in the ever-evolving realm of technology.
 We use cookies to ensure that we give you the best experience on our website and show you relevant advertising. If you continue to use this site we will assume that you are happy with it. To find out more read our