


Logging practices in DevOps transform raw data into actionable insights, fostering a culture of accountability and enhancing system reliability.
Logging in DevOps has become a crucial aspect of efficient application delivery and development, enabling teams to monitor and troubleshoot issues seamlessly. Knowing the best logging practices and devops logging tools is essential in log management in devops.
DevOps teams require effective logging practices and tools to ensure system stability and improve application performance. Implementing the right logging practices empowers teams to detect and fix issues, optimize system performance, and meet compliance requirements.
Why Logging Matters in DevOps
Logging is a critical component of any DevOps environment, enabling teams to detect and fix issues quickly, ensure system stability, and improve application performance. In a nutshell, logging provides a detailed record of events and activities within a system, which can be analyzed to identify errors, anomalies, and performance bottlenecks.
Without logging, DevOps teams would be working blindly, unable to gain visibility into what’s happening in their systems or applications. This is why effective log management in DevOps is essential, providing teams with the insights they need to optimize system performance, ensure compliance, and mitigate security risks.
Logging is particularly important in a DevOps environment, where teams are continuously deploying and monitoring applications. With quick feedback and constant iteration, DevOps teams can quickly pinpoint issues and improve the overall quality of their applications.
Best Practices for DevOps Logging
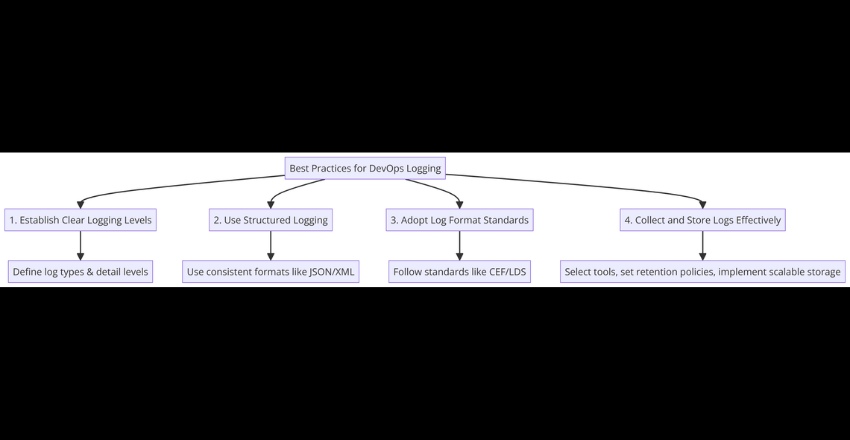
Effective logging practices are essential for DevOps teams to ensure efficient application development and delivery. Here are some best practices to consider:
1. Establish Clear Logging Levels
Different types of logs provide varying levels of detail, so it’s crucial to establish clear logging levels that outline the types of logs and the level of detail they should contain. This helps to ensure that logs are easy to read and analyze, and facilitates efficient troubleshooting and debugging.
2. Use Structured Logging
Structured logging involves defining a standard log format, such as JSON or XML, and sticking to it consistently. This helps to ensure that logs are easy to read and analyze, and enables efficient log aggregation and correlation.
3. Adopt Log Format Standards
Adhering to log format standards, such as the Common Event Format (CEF) or the Log Data Standard (LDS), can improve log quality and compatibility across different systems and tools. This helps to ensure that logs can be efficiently analyzed and correlated across the entire DevOps infrastructure.
4. Collect and Store Logs Effectively
To extract the most value from your logs, you need to ensure that they are collected and stored effectively. This means selecting appropriate log collection tools and mechanisms, establishing retention policies that align with business requirements, and implementing a scalable log storage solution that can grow with your infrastructure.
By following these best practices, DevOps teams can ensure that their logging infrastructure is robust, and that logs are efficiently collected, analyzed, and used to improve application quality and performance.
Choosing the Right Logging Tools for DevOps
Choosing the right logging tool is crucial for effective monitoring and troubleshooting in a DevOps environment. With numerous options available, selecting the best tool can be overwhelming. It’s essential to consider factors such as the tool’s features, integrations, scalability, ease of use, and cost.
DevOps Logging Tools Comparison
Here are some popular DevOps logging tools and a brief overview of their features:
| Tool | Features |
|---|---|
| ELK Stack | Open-source platform with Elasticsearch, Logstash, and Kibana components for collecting, processing, and analyzing logs. Provides real-time monitoring, search, and visualization features. |
| Splunk | Proprietary platform for log analysis, indexing, and search. Offers customizable dashboards, alerts, and machine learning capabilities. |
| Sumo Logic | Cloud-based service for log management, analytics, and troubleshooting. Includes machine learning features and pre-built dashboards for various applications and services. |
| Graylog | Open-source platform for log collection, processing, and analysis. Includes real-time search, stream processing, and alerting features. |
Other notable logging tools include Fluentd, Logz.io, Papertrail, and Datadog. Teams should evaluate these tools’ features and compare them against their specific requirements and constraints. It’s also important to choose a tool that integrates easily with their existing DevOps infrastructure and toolset.
Scalability and Performance
Another critical factor to consider when selecting a logging tool is its scalability and performance. Teams should evaluate how the tool handles high log volumes and whether it can support their current and future needs. They must also consider the resource overhead of running the tool and how it may affect their system’s performance.
Ease of Use and Cost
Finally, teams should consider the logging tool’s ease of use and cost. The tool should be easy to set up, configure, and maintain, with sufficient documentation and support available. Additionally, teams must compare the tool’s licensing and subscription fees against their budget and expected return on investment. They may also consider open-source and free alternatives, but they should ensure that these tools meet their requirements and are backed by an active community and support.
Choosing the right logging tool for DevOps is a critical decision that can significantly impact a team’s ability to monitor and troubleshoot their applications. By considering the factors detailed above, teams can find a tool that meets their specific needs and requirements, enhances their DevOps practices, and helps deliver high-quality applications quickly.

Logging Configuration Examples for DevOps
In a DevOps environment, efficient logging practices are crucial for system stability and effective troubleshooting. Here are some examples of logging configuration in popular DevOps frameworks:
Docker
Docker provides a built-in logging driver for capturing container output and storing it in different formats, including JSON and Syslog. To configure logging in Docker, you can use the –log-driver and –log-opt options when running a container.
Kubernetes
Kubernetes supports various logging solutions, including Elasticsearch, Fluentd, and Stackdriver. By default, Kubernetes stores container logs in a file on the node’s filesystem. To configure logging in Kubernetes, you can use the –log-dir or –logtostderr options when starting the Kubernetes components.
AWS
AWS offers various logging services, including CloudWatch Logs, which can collect logs from EC2 instances and other AWS resources. To configure CloudWatch Logs, you can use the AWS Management Console or the AWS CLI.
To configure CloudWatch Logs for collecting logs from EC2 instances using the AWS CLI, you typically need to perform a few steps.
These include installing and configuring the CloudWatch Logs agent on your EC2 instance, and creating a log group and stream if they don’t already exist. Below is a simplified example to get you started:
Step 1: Install the CloudWatch Logs Agent on Your EC2 Instance
For Amazon Linux 2 or Ubuntu, the CloudWatch Logs agent is now part of the unified CloudWatch agent. You need to download and install the CloudWatch agent using the AWS CLI.
# For Amazon Linux 2
sudo yum install -y amazon-cloudwatch-agent

# For Ubuntu
sudo apt-get update && sudo apt-get install -y amazon-cloudwatch-agent
Step 2: Create a CloudWatch Agent Configuration File
Create a JSON configuration file for the CloudWatch agent. This file specifies what logs to collect and where to send them. Save this as cloudwatch-config.json.
{
"logs": {
"logs_collected": {
"files": {
"collect_list": [
{
"file_path": "/var/log/syslog",
"log_group_name": "my-log-group",
"log_stream_name": "my-log-stream",
"timezone": "Local"
}
]
}
}
}
}
This configuration collects logs from /var/log/syslog and sends them to a log group named my-log-group and a log stream named my-log-stream.
Step 3: Start the CloudWatch Agent with the Configuration File
First, use the AWS CLI to put the agent configuration file to the CloudWatch service. Then, start the CloudWatch agent using this configuration.
sudo /opt/aws/amazon-cloudwatch-agent/bin/amazon-cloudwatch-agent-ctl \
-a fetch-config -m ec2 -c file:cloudwatch-config.json -s
Step 4: Verify the Logs in CloudWatch
After the agent is running, log in to the AWS Management Console, navigate to the CloudWatch Logs section, and verify that your logs are appearing in the specified log group and stream.
Additional Notes
- You might need to adjust file paths or log group/stream names based on your specific requirements.
- Ensure that your EC2 instance has an IAM role with the necessary permissions to send logs to CloudWatch.
- The CloudWatch agent configuration can also include metrics collection, which is not covered in this basic example.
This example provides a basic setup. For more detailed configurations, including advanced features such as log file rotation handling, exclusion patterns, and more, refer to the Amazon CloudWatch documentation.
Centralized Logging in DevOps
Centralized logging is a logging architecture that consolidates log data from multiple sources into a single location, simplifying log management and analysis. In a DevOps environment, centralized logging offers several benefits, including:
- Improved troubleshooting: Centralized logging makes it easier to identify the root cause of issues by providing a unified view of application performance across multiple systems and environments.
- Enhanced security: By aggregating logs in a single location, centralized logging makes it easier to detect security threats and monitor compliance with industry regulations.
- Efficient resource utilization: Centralizing log data reduces the impact of logging on system resources and allows for more effective analysis of log data.
However, implementing centralized logging in a DevOps environment can be challenging, especially when dealing with large volumes of log data and multiple, distributed systems. To optimize log collection, storage, and analysis, consider the following tips:
| Tip | Description |
|---|---|
| Use a log aggregator | A log aggregator is a tool that collects log data from multiple sources and sends it to a centralized repository for storage and analysis. Popular log aggregators include Fluentd, Logstash, and Graylog. |
| Define a log schema | Create a standard format for log data that includes fields for important metadata such as timestamp, hostname, and application name. This will make it easier to parse and analyze logs in a centralized location. |
| Use log rotation | To reduce the impact of logging on system performance, implement log rotation policies that limit the size of log files and ensure that older log data is removed or archived regularly. |
| Ensure log security | Centralized logging can pose security risks if log data is not kept confidential and secure. Use encryption protocols such as TLS/SSL to encrypt log data over the network, and implement access controls and authentication mechanisms to restrict access to log data. |
By following these best practices for centralized logging, DevOps teams can ensure that their log data is organized, secure, and easy to analyze, leading to more efficient troubleshooting, better performance, and improved overall application delivery.
Real-Time Log Monitoring in DevOps
Real-time log monitoring is crucial for DevOps teams to quickly identify and fix issues in applications and infrastructure. Without it, teams risk prolonged outages, poor user experiences, and increased downtime.
To ensure effective real-time log monitoring, DevOps teams should use tools that offer advanced filtering, search, and alerting capabilities. These tools should be capable of collecting logs from multiple sources and displaying them in a centralized location for easy analysis.
One popular real-time log monitoring tool is ELK Stack, which stands for Elasticsearch, Logstash, and Kibana. It is an open-source solution that allows teams to filter, search, and visualize logs in real-time.
Another example is Splunk, which offers real-time log monitoring, analysis, and visualization capabilities. Splunk provides a platform that can scale to meet the needs of large enterprise environments.
Techniques for Real-Time Log Monitoring
There are several techniques DevOps teams can use to optimize real-time log monitoring:
- Event Correlation: This technique helps teams identify patterns and relationships between events, allowing for quicker problem resolution.
- Custom Dashboards: Creating custom dashboards enables teams to monitor specific metrics or issues that are important to their applications.
- Automated Alerts: Setting up automated alerts for critical events ensures that teams are notified immediately when issues arise, allowing for quick remediation.
By utilizing these techniques and tools, DevOps teams can ensure that they are continuously monitoring their applications and infrastructure for any potential issues, reducing downtime and improving user experiences.
Analyzing Logs for Insights in DevOps
Logs are not only useful for detecting issues and errors, but they also contain valuable insights that can help improve application performance and user experience. Analyzing logs can provide valuable information about user behavior, application usage patterns, and system performance. In this section, we will explore some techniques and tools for analyzing logs in a DevOps environment.
Log Parsing
Log parsing involves breaking down log files into smaller components, making them easy to analyze. Parsing logs can help identify patterns, trends and anomalies that are not easily visible in a raw log file. There are many log parsing tools available, ranging from simple command-line utilities to complex web-based applications that provide advanced parsing capabilities.
One popular log parsing tool is the Elastic Stack, which includes Elasticsearch, Logstash, and Kibana. Logstash is a data processing pipeline that ingests, parses, and transforms data from various sources, including log files. Elasticsearch is a search and analytics engine that stores the parsed data, and Kibana provides a graphical interface for visualizing the data.
Anomaly Detection
Anomaly detection involves identifying and flagging unusual events or patterns in log data. Anomaly detection algorithms work by analyzing log data for patterns, comparing them to historical data, and identifying any deviations. This technique can help identify security breaches, performance issues, and optimization opportunities.
One popular anomaly detection tool is the Anomaly Detection feature in Sumo Logic. This feature uses advanced machine learning algorithms to detect anomalies in log data, helping DevOps teams identify critical issues before they impact end-users.
Trend Analysis
Trend analysis involves analyzing log data over time to identify patterns and trends. This technique can help identify recurring issues and provide insights into system performance and user behavior. Trend analysis is particularly useful for capacity planning, identifying potential performance bottlenecks, and measuring the impact of new features on user behavior.
One popular tool for trend analysis is Grafana, an open-source platform for data visualization and analytics. Grafana can be used to visualize log data in real-time, create interactive dashboards, and set up alerts based on specific metrics.
Effective log analysis requires a combination of techniques and tools, along with a thorough understanding of the application and underlying system architecture. DevOps teams should invest in the right tools and processes to ensure that critical insights are not missed, and that logs are used to their full potential.
Security and Compliance Considerations in DevOps Logging
While logging is essential for monitoring and troubleshooting in a DevOps environment, it is crucial to also consider security and compliance measures when implementing logging practices. Neglecting these factors can lead to security breaches, data loss, and legal liabilities.
Log Encryption: To protect sensitive data from unauthorized access, it is recommended to encrypt logs in transit and at rest. Log encryption should be implemented using industry-standard algorithms and key management practices.
Access Controls: Access to logs should be restricted to authorized personnel only, using role-based access control (RBAC) and multi-factor authentication (MFA) mechanisms. Access logs should also be maintained to track and audit log access activities.
Log Retention Policies: To comply with data protection regulations and industry standards, it is crucial to determine the appropriate log retention periods and to securely dispose of logs when they are no longer needed. Retention policies should be based on business and legal requirements and should consider the type of data stored in logs.
By incorporating security and compliance measures in logging practices, DevOps teams can ensure the confidentiality, integrity, and availability of logs, mitigating risks and maintaining trust with customers and stakeholders.
Managing Log Volume and Performance in DevOps
In a DevOps environment, effective log management is crucial to monitor system health, troubleshoot issues, and ensure optimal application performance. However, the volume of logs generated by multiple applications and systems can quickly add up and become unmanageable, impacting overall system performance.
Strategies for Handling Large Log Volumes
One of the key challenges in DevOps logging is managing large volumes of logs without compromising system performance. Here are some strategies for handling log volume:
- Log filtering: Configure log collection systems to filter out low-priority logs that are not critical for monitoring or troubleshooting. This can significantly reduce log volume and help optimize log analysis.
- Log rotation: Set up log rotation policies to archive logs after a certain time period or when they reach a certain size. This can help optimize storage usage and improve log analysis performance.
- Distributed logging: Implement distributed logging systems, such as Elasticsearch, to distribute log collection and analysis across multiple nodes. This can help scale log collection and analysis while improving system performance.
Optimizing Log Collection and Storage
Another challenge in DevOps logging is optimizing log collection and storage without impacting system performance. Here are some tips for optimizing log collection and storage:
- Log compression: Configure log collection systems to compress logs during collection to reduce storage usage and improve log analysis performance.
- Log aggregation: Use log aggregation tools like Fluentd or Logstash to consolidate logs from different sources into a single location. This can help simplify log analysis and reduce storage usage.
- Log retention policies: Implement log retention policies to define how long logs should be retained and when they should be deleted. This can help optimize storage usage and improve log analysis performance.
By implementing these strategies, DevOps teams can effectively manage log volumes and ensure optimal system performance without compromising log analysis capabilities.
Troubleshooting with Logs in DevOps
Logs are an invaluable tool in troubleshooting issues in a DevOps environment. When an issue occurs, logs can provide valuable insight into what went wrong and how to fix it. Here are some key steps for using logs in troubleshooting:
Log Filtering
Filtering is the process of isolating specific log entries based on certain criteria, such as time stamps, severity levels, or keywords. This can reduce the number of log entries to review and help focus on the relevant ones.
Log Correlation
Correlation involves analyzing multiple logs from different sources to identify patterns and relationships between events. This can reveal the root cause of an issue that might not be apparent from a single log file.
Error Analysis
When an error occurs, it is critical to analyze the associated logs to pinpoint the cause of the error. Errors can be identified by searching for specific error messages or codes, as well as their severity levels.
Log Visualization
Visualizing logs in real-time can help identify trends and patterns that may be missed when reviewing logs manually. Tools like dashboards and graphs can be used to display log data in a visually appealing way, making it easier to spot anomalies.
By following these steps, DevOps teams can effectively use logs to troubleshoot issues and ensure smooth operations.
Final Thoughts

Effective logging practices play a critical role in the success of DevOps teams. By implementing best practices for logging levels, structured logging, and log format standards, teams can ensure efficient monitoring and troubleshooting, as well as improved application performance and system stability.
By following these best practices and considering the challenges and opportunities of log management in DevOps, teams can maximize the value of logs and ensure the continuous delivery of high-quality applications.
External Resources
https://www.sumologic.com/
https://www.splunk.com/
https://aws.amazon.com/what-is/elk-stack/#:~:text=The%20ELK%20stack%20is%20an,Elasticsearch%2C%20Logstash%2C%20and%20Kibana.
FAQ

FAQ 1: How do I implement structured logging in a Python application for better DevOps practices?
Answer: Structured logging can significantly improve log readability and parsing, essential for effective monitoring and analysis in DevOps. Here’s how to implement it using Python’s logging module and the json library:
import logging
import json

logger = logging.getLogger(__name__)
logger.setLevel(logging.INFO)

handler = logging.StreamHandler()
formatter = logging.Formatter('%(asctime)s - %(name)s - %(levelname)s - %(message)s')
handler.setFormatter(formatter)
logger.addHandler(handler)

def log_structured(message, **kwargs):
logger.info(json.dumps({'message': message, **kwargs}))

log_structured('User login attempt', user='johndoe', status='success')
This code configures a basic logger to output JSON formatted logs, making them easier to parse by log management tools.
FAQ 2: How can I configure log rotation for my application logs to manage disk space in DevOps environments?
Answer: Log rotation is crucial for managing disk space, ensuring that logs do not consume excessive resources. Python’s logging.handlers.RotatingFileHandler supports automatic log rotation by file size. Here’s an example configuration:
import logging
from logging.handlers import RotatingFileHandler

logger = logging.getLogger(__name__)
logger.setLevel(logging.INFO)

# Configure log rotation for 5MB per file, keeping 3 backups
handler = RotatingFileHandler('app.log', maxBytes=5*1024*1024, backupCount=3)
formatter = logging.Formatter('%(asctime)s - %(name)s - %(levelname)s - %(message)s')
handler.setFormatter(formatter)
logger.addHandler(handler)

logger.info('This is a test log message.')
This setup automatically rotates the logs, maintaining up to 3 backup files each limited to 5MB.
FAQ 3: How do I configure centralized logging in a microservices architecture for DevOps monitoring?
Answer: Centralized logging is essential in a microservices architecture for aggregating logs from various services. Fluentd, an open-source data collector, is commonly used. Here’s an example Fluentd configuration to forward logs to Elasticsearch:
<source>
@type forward
port 24224
</source>

<match **>
@type elasticsearch
host "elasticsearch_host"
port 9200
logstash_format true
include_tag_key true
tag_key @log_name
flush_interval 10s
</match>
In your services, configure log forwarding to Fluentd:
import logging
import msgpack

logger = logging.getLogger(__name__)
logger.setLevel(logging.INFO)

def forward_to_fluentd(message):
# Assuming Fluentd is listening on localhost:24224
sock = socket.socket(socket.AF_INET, socket.SOCK_DGRAM)
packed_message = msgpack.packb({"message": message})
sock.sendto(packed_message, ("localhost", 24224))

forward_to_fluentd('Service A log message.')
This setup allows logs from various services to be aggregated into Elasticsearch, facilitating centralized monitoring and analysis.
 We use cookies to ensure that we give you the best experience on our website and show you relevant advertising. If you continue to use this site we will assume that you are happy with it. To find out more read our